Skip to content
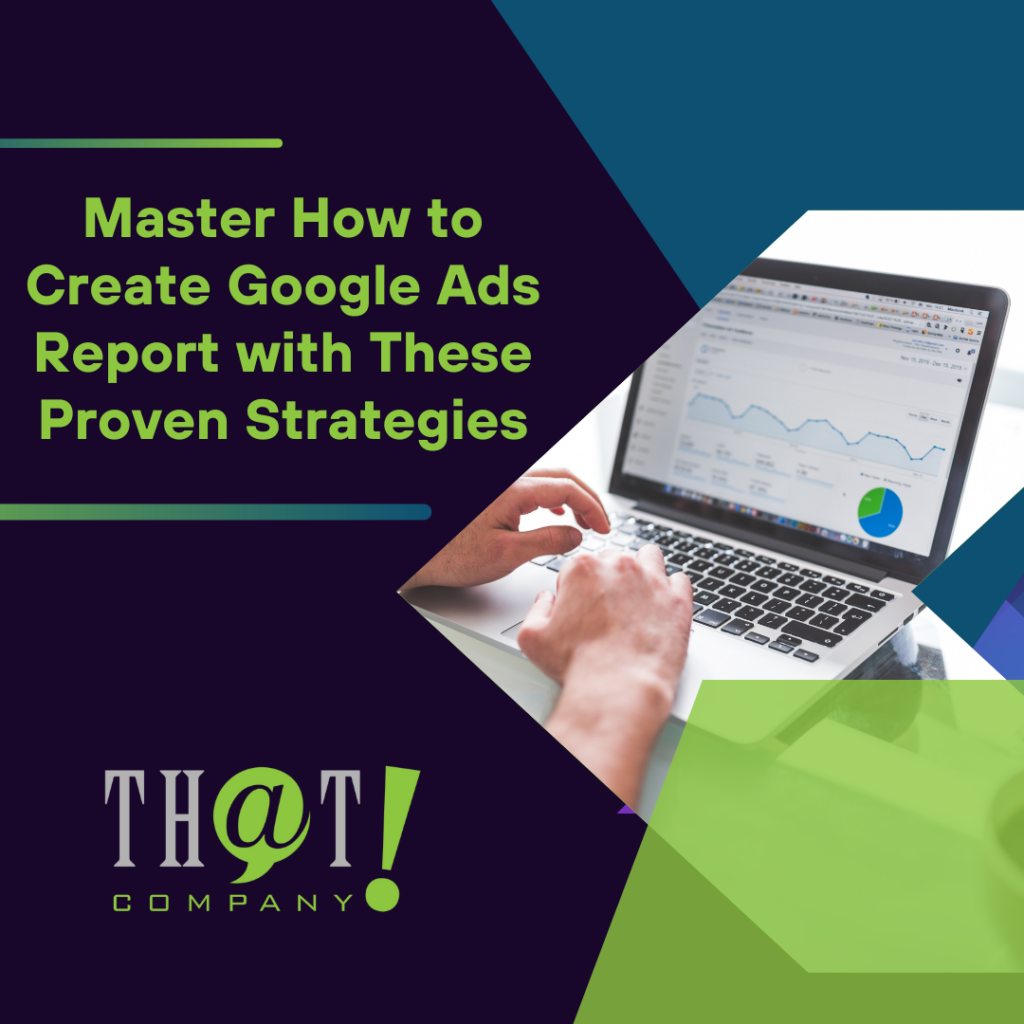
Struggling with how to create Google Ads report that offers real insights? This succinct guide is crafted to help you swiftly navigate through Google Ads’ complexity, identify the metrics that matter, and present your data with clarity. Here you’ll find the necessary steps to extract, analyze, and report the findings that will drive your strategic decisions—no fluff, just the essentials.
Key Takeaways
- Efficient Google Ads report creation relies on selecting relevant metrics such as CPA and LTV, setting the appropriate date range for analysis, and using predefined templates to structure reports for detailed campaign insights.
- Custom report layouts with personalized dimensions, metrics, and data visualizations provide an enhanced understanding of campaign performance, while filters help zero in on the significant data for granular analysis.
- For a comprehensive analysis, integrating Google Analytics and third-party tools augments Google Ads reports with richer data, improved targeting, and deeper insights while optimizing reports for actionable insights helps to refine advertising strategies and improve ROI.
Essentials of Google Ads Report Creation
Mastering the essentials of report creation is key to efficiently tracking your Google Ads campaigns. From navigating the overview page to choosing pertinent metrics and setting the optimal date range for analysis, each step helps shape a comprehensive report that reveals valuable insights into your campaigns.
Starting Your Google Ads Report
Though it might seem daunting at first, starting a Google Ads report is relatively straightforward. With the power of a predefined Google Ads report template, you can hit the ground running. These templates serve as your springboard into detailed analysis, offering a suitable structure to understand various performance aspects like campaign, ad group, and keyword performance. Additionally, a PPC report template can be a valuable resource for those managing pay-per-click campaigns.
All you need is to sign in to your Google Ads account, navigate to ‘Campaigns’, select ‘Insights & reports’, and finally click on ‘Report editor’.
We are the leader in helping large and small agencies deliver Google Ads Management and other PPC Services to their clients. Can we help you? Check out more about Our White Label PPC Management Services to learn more about what we can do to help you deliver results to your clients today.
Choosing Metrics That Matter
After initiating your report, the subsequent course of action is to select the significant metrics. These metrics are your compass, guiding your advertising strategy toward its goals. Pivotal metrics like Cost per Acquisition (CPA) and Lifetime Value (LTV) can offer crucial insights into profitability and investment decisions in customer acquisition.
Remember, the relevance of these key metrics depends on your specific goals, data preferences, and the priorities of stakeholders.

Setting the Date Range for Analysis
Setting an appropriate date range, which serves as a time window for your analysis, is of utmost importance. Whether you’re analyzing performance over the last 7 days or the last 12 months, Google Ads allows you to select from predefined date ranges or choose a custom range using the calendar function. This feature is particularly useful during promotional campaigns or seasonal events, where specific periods are of interest.
Additionally, the comparison feature helps detect anomalies and gain accurate context by comparing your selected date range against a standard performance data baseline.
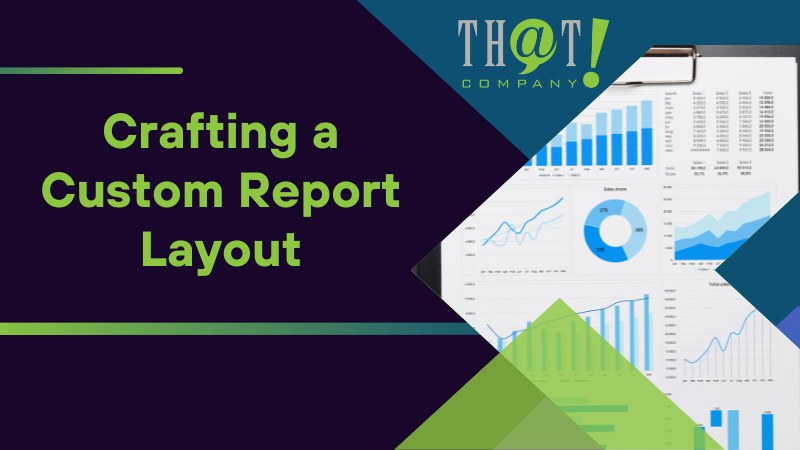
Crafting a Custom Report Layout
Creating a custom report layout using a report template is like having a suit tailor-made to perfectly fit your needs. You can add dimensions and metrics, visualize data using charts and tables, and filter the data to focus on what matters most to you.
With Google Ads reports, customization is not just an option but a powerful tool.
Adding Dimensions and Metrics
Similar to adding threads to a tapestry for a complete picture, adding dimensions and metrics contributes to the overall report. With the Report Editor tool, you can select specific columns, and rows, and even choose the type of chart or table for data presentation. Whether it’s pairing ‘Campaigns’ with ‘Clicks’ and ‘Conversions’ or creating custom columns to emphasize the metrics that matter most to you, adding dimensions and metrics enhances the report’s relevance and usefulness.
Visualizing Data with Charts and Tables
Data visualization offers a potent method for comprehending and interpreting intricate information. Whether it’s a line graph tracking performance trends over time or a bar chart comparing performance metrics across campaigns or ad groups, the right visualization can make your data speak volumes.
With the range of visualization options in the Report Editor, you can create compelling stories that are easily comprehensible and actionable.
Filtering to Focus on What Counts
Amid the vast sea of data, filters function as your beacon, directing you to the genuinely significant data. Google Ads Report Editor’s hierarchical data views and chart drill-downs let you explore data from the account level down to campaigns and ad groups for granular analysis.
With custom filters, you can apply specific conditions to your reports, such as focusing on selected campaigns or metrics. Plus, once created, these filters can be saved for future use, saving you time and effort.
Analyzing Campaign Effectiveness
Examining campaign effectiveness equates to performing a health check for your advertising initiatives, including your online marketing efforts. It entails understanding:
- Conversions
- Total conversion values
- Click-through rates
- Ad copy relevance
Armed with this knowledge, you can diagnose areas of improvement and devise strategies for enhanced performance.
Understanding Conversion Rate and Total Conversion Value
Conversion rate and total conversion value are two vital signs of your campaign’s health. They reveal the effectiveness of your ads in persuading users to complete a desired action and the aggregate value of all those conversions respectively. By evaluating metrics like Conversion Value per Cost and Conversion Value per Click, you can gain insights into profitability and inform strategy adjustments for better ROI.
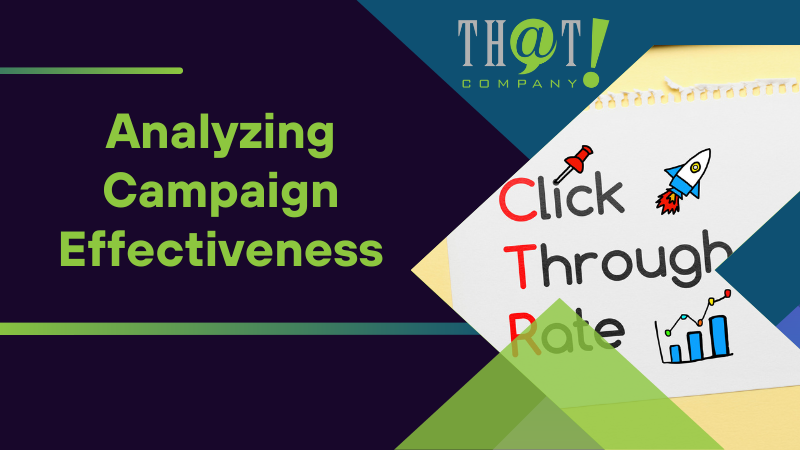
Evaluating Click Through Rate and Ad Copy Relevance
Click-through rate and ad copy relevance are akin to your campaign’s pulse and blood pressure – they highlight the ad’s ability to attract users and its relevance to their search intent. A high click-through rate indicates effective ad content, while a low one might signal the need for optimization.
Reviewing your ad copy can reveal which calls-to-action resonate most with searchers and which text variations work best, allowing you to craft compelling ad content.
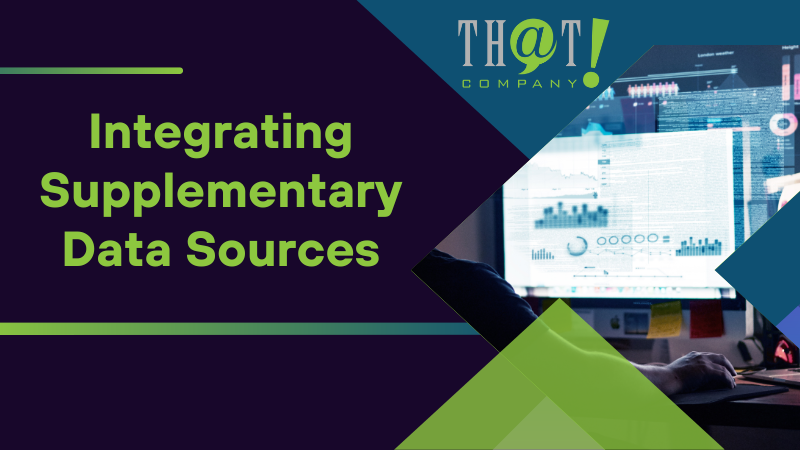
Integrating Supplementary Data Sources
The integration of supplementary data sources adds additional layers of depth to your analysis. By combining data from Google Analytics and third-party tools, you can glean deeper insights and enhance your reporting capabilities.
Linking Google Analytics for Deeper Insights
Linking Google Ads to Google Analytics offers the following benefits:
- Richer data
- Improved targeting
- Better measurement
- Importing Analytics goals and E-commerce transactions into your Google Ads account gives you a clearer picture of user behaviors post-click.
Leveraging Third-Party Tools for Enhanced Reporting
Leveraging third-party tools for enhanced reporting is like adding extra accessories to your toolkit. Platforms like:
Offer customized Google Ads reports, providing you with robust integration, attractive report design, ROI tracking, and more.

Automating and Sharing Reports Efficiently
Setting your advertising strategy on autopilot is comparable to automating and sharing reports in the realm of digital marketing. By scheduling regular updates and enabling collaborative access, you can ensure consistent, efficient, and collaborative reporting.
Scheduling Regular Report Updates
Scheduling regular updates is like programming your report creation process. It ensures that reports are automatically generated and shared at specific intervals, saving you time and effort.
With automated Google Ads reporting for online marketing, you can receive regular updates on campaign performance, surfacing valuable insights for actionable decisions.
Collaborative Access and Distribution
Collaborative access and distribution is like opening the doors of your Google Ads account to a team. By allowing multiple users to work together, you can streamline the report creation and sharing process. Reports can be internally shared, edited, and even scheduled within the ‘Insights & reports’ section of Google Ads.
For external sharing, reports can be sent as email attachments, stored in the cloud, or made accessible through client portals.
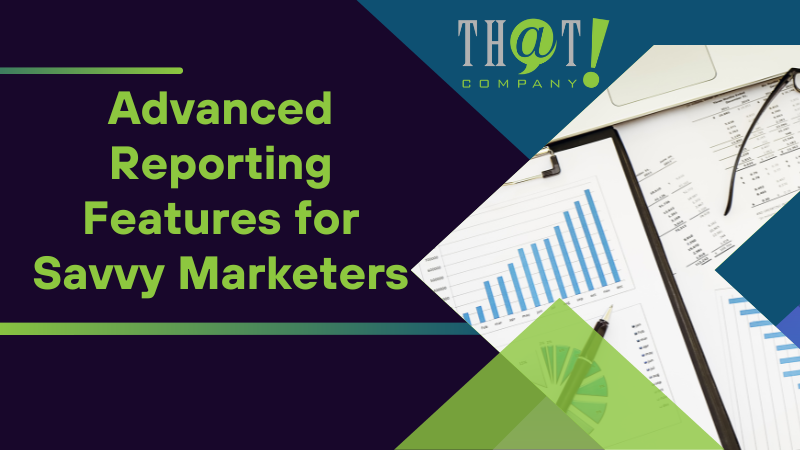
Advanced Reporting Features for Savvy Marketers
Google Ads reports offer a multitude of advanced features for those interested in going beyond the basics. From customization options for branding to cross-campaign comparisons, these features provide savvy marketers with a competitive edge in managing their own Google Ads accounts.
Customization Options for Branding
Customization options for branding allow you to make your reports truly your own. Some options for customization include:
- Adding logos
- Altering the report’s CSS to match brand colors
- Custom headers
- Widget colors
- Fonts
All these options enhance the visual appeal and deliver a seamless client experience.
Utilizing Cross-Campaign Comparisons
Cross-campaign comparisons serve as your magnifying glass, enabling you to spot trends and patterns across different campaigns. Through these comparisons, you can identify the most common ad combinations and their performance metrics, revealing which ad elements are more successful.
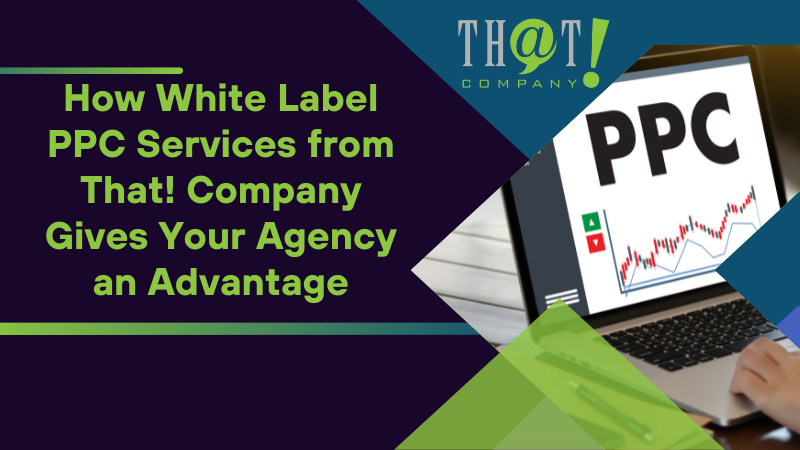
How White Label PPC Services from That! Company Gives Your Agency an Advantage
Your agency can gain a significant advantage by leveraging white label PPC services. With white label digital marketing agency from That! Company, you gain access to a team of PPC specialists, enjoy comprehensive services, and receive personalized client support. Plus, these services help expand your offerings, build trust, and improve client retention. We handle creating your client’s Google Ads report for you!
By utilizing our white label PPC management service, your agency can seamlessly scale without the overhead of hiring additional staff. Gain the flexibility to meet client demands even during peak seasons or when expanding your business. Our team acts as an extension of your own, working diligently behind the scenes to deliver top-notch PPC campaigns that align with your agency’s standards and client expectations. With That! Company, you’re not just outsourcing tasks; you’re enhancing your agency’s capability to deliver a full suite of digital marketing services. Take advantage of our expertise to grow your client base and solidify your market position.
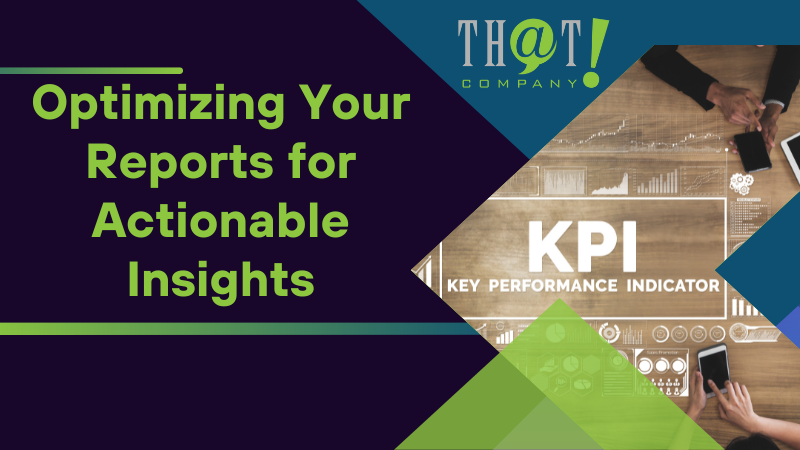
Optimizing Your Reports for Actionable Insights
Optimizing reports for actionable insights can be compared to fine-tuning a car for peak performance. By highlighting key performance indicators (KPIs) and deriving actionable tactics from data, you ensure that your reports not only reveal what’s happening but also guide you on what to do next.
Highlighting Key Performance Indicators (KPIs)
Highlighting KPIs in your reports is like setting landmarks on your journey towards achieving your advertising goals. These indicators, like ad spend, costs per click (CPC), and return on ad spend (ROAS), help quickly gauge campaign performance and keep you focused on performance drivers.
Deriving Actionable Tactics from Data
Deriving actionable tactics from your data is like decoding a secret message. It allows you to use insights to enhance ad performance, boost conversion rates, reduce costs, and evaluate return on ad spend (ROAS). With these tactics, you can refine your targeting, alter keywords, adjust bids, and optimize your ad spend for better returns.
Summary
Mastering Google Ads reports is not just about understanding data but also about translating that understanding into actionable strategies. Whether it’s crafting custom reports, analyzing campaign effectiveness, integrating supplementary data sources, or automating and sharing reports efficiently, each step brings you closer to a data-driven advertising strategy. So, start today and let your data lead the way!

Frequently Asked Questions
How do I create an ad report?
To create an ad report, choose the network you want to report on (Facebook or Google ads), select a blank report, set it up by entering a report name, and select the data you want to report on, such as campaigns, ad accounts, or tags for Facebook, and campaigns or ads for Google.
How do I extract a report from Google Ads?
To extract a report from Google Ads, you can connect your Google account with access to Google Ads, select the ad account, and choose the data entity to export, such as ad performance or campaign performance. Alternatively, you can sign in to Google Ad Manager, create and run a report, and then export the results with your preferred settings.
How do I report ads on Google ads?
To report ads on Google, you can use the ad reporting form provided by Google. Provide the necessary details and the fake ad should be resolved within a few days.
What are some key performance indicators (KPIs) I should track in my Google Ads report?
In your Google Ads report, it’s crucial to track KPIs such as ad spend, CPC, and ROAS to effectively measure your campaign’s performance and optimize your strategy.
Can I automate and share my Google Ads reports?
Yes, you can automate and share your Google Ads reports by scheduling them for automatic generation and sharing at specific intervals. Multiple users can also collaborate on Google Ads accounts and share reports internally or externally.